
Threats & Hindrances to Water Quality
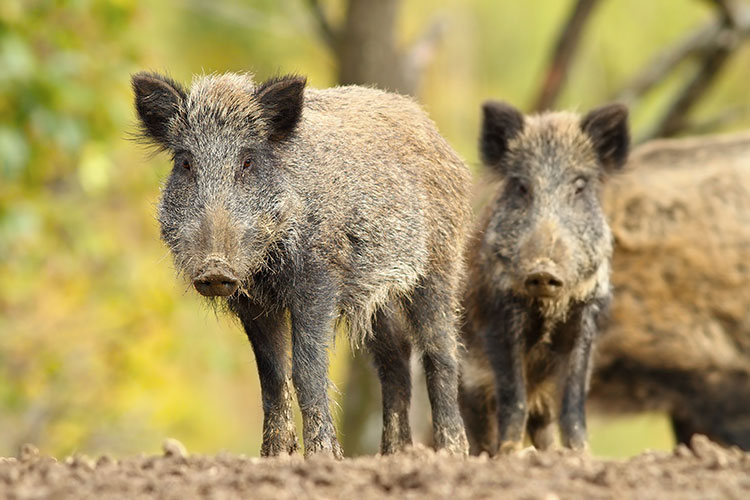
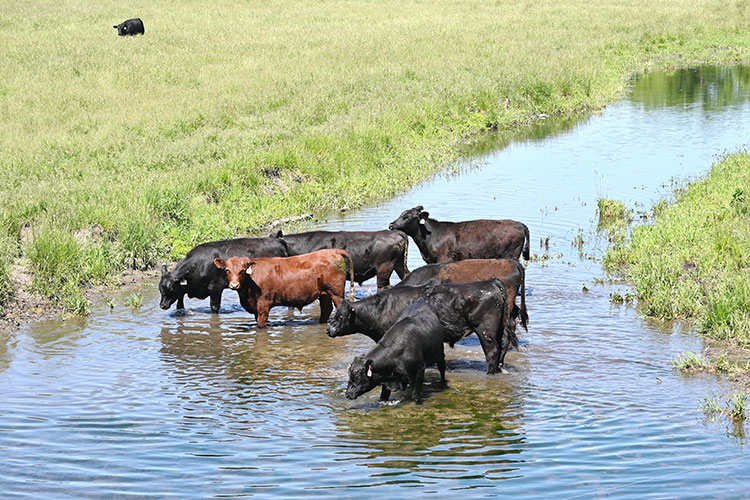
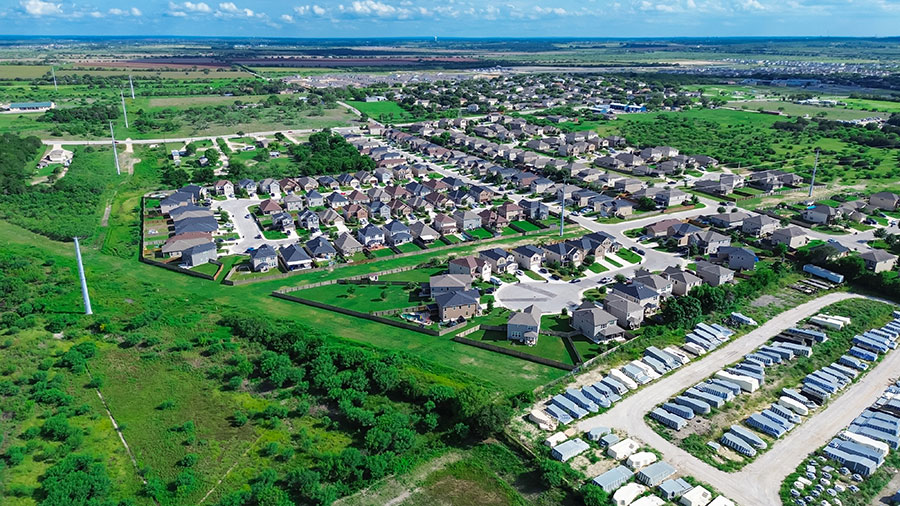
The primary threats to water quality in Geronimo and Alligator Creeks come from both urban and rural sources. Wastewater, urban runoff, and pet waste contribute to elevated bacterial levels in water. From agricultural lands, cattle, goats, horses, deer, feral hogs, and malfunctioning septic systems can also threaten local water quality. Feral hogs are particularly destructive in small creeks and riparian areas, and can damage cropland and suburban landscapes
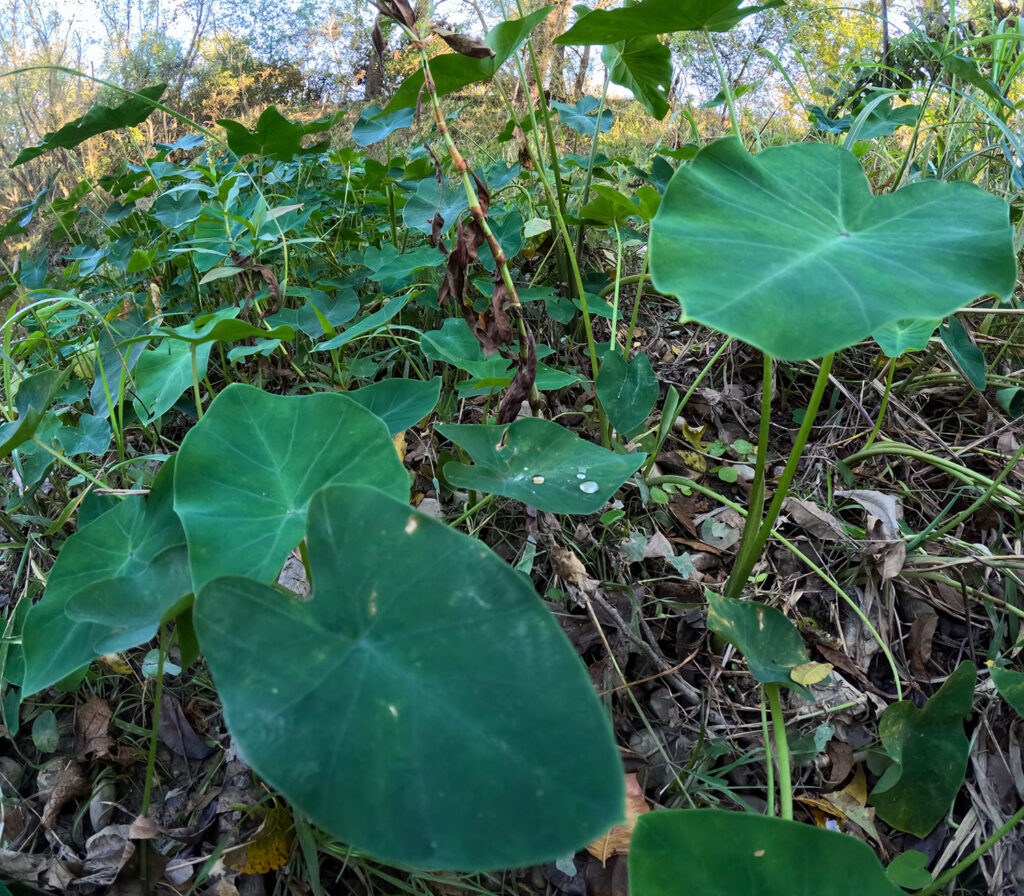
Invasive or non-native plant species can also degrade water quality. Common invasive plants in this watershed include Giant cane (Arundo donax) and Elephant ear (Colocasia esculenta) which can outcompete or eliminate native species, thus altering natural habitats and ecosystems, especially in riparian areas. The degradation of native plant communities can contribute to increased erosion, inhibited water flows, and even eutrophication.
The map below shows locations of the water quality monitoring sites within the Geronimo and Alligator Creeks watershed, as well as the wastewater treatment outfall location in Seguin.

Geronimo Creek Watershed Stations Map
Using the map below, click on a station to get information on the location and a link to the current data collected at the site. Alternatively, you can also view a list of sampling sites.

Bacterial Source Tracking Handout
The Guadalupe-Blanco River Authority (GBRA) conducted Bacterial Source Tracking sampling to genetically test fecal bacteria collected
from the Geronimo Creek to identify their origins.

Quality Assurance Project Plan 2023
The purpose of this QAPP is to clearly delineate GBRA QA policy, management structure, and procedures, which are used to implement the QA requirements necessary to verify and validate the surface water quality data collected.
Water quality, sources of nitrate, and chemical loadings in the Geronimo Creek and Plum Creek watersheds, south-central Texas, April 2015–March 2016
Prepared in cooperation with the Guadalupe-Blanco River Authority and the Texas State Soil and Water Conservation Board.
List of Stations
Using the list below, click on a link in the Data Table column to get the current data collected at the site. Alternatively, you can also view a map of sampling sites.
| Site No. | Site Name | Lat. | Long. | Sample Type | Data to August 2020 | Data from September 2020 |
| 12575 | Geronimo Creek @ FM 20 | 29.62 | 97.93 | Weather Targeted | Excel | Excel |
| 12576 | Geronimo Creek @ Haberle Rd | 29.63 | 97.94 | Monthly | Excel | Excel |
| 14932 | Geronimo Creek @ SH 123 | 29.67 | 97.97 | Monthly | Excel | Excel |
| 20742 | Geronimo Creek @ Huber Rd, Upstream of Alligator Creek Confluence | 29.67 | 97.99 | Monthly | Excel | Excel |
| 20743 | Alligator Creek @ Huber Rd (Headwater) | 29.68 | 97.99 | Monthly | Excel | Excel |
| 20744 | Baer Creek @ East Walnut Street | 29.58 | 97.93 | Weather Targeted | Excel | Excel |
| 20745 | Geronimo Creek @ Hwy 90A | 29.66 | 97.60 | Monthly | Excel | Excel |
| 20746 | Geronimo Creek at Mt. Vernon, downstream of Bear Creek Confluence | 29.57 | 97.92 | Retired | Excel | – |
| 20747 | Geronimo Creek @ Hollub Lane | 29.55 | 97.92 | Monthly | Excel | Excel |
| 20748 | Alligator Creek @ FM 1102 | 29.77 | 98.08 | Weather Targeted | Excel | Excel |
| 20749 | Alligator Creek @ FM 1101 | 29.73 | 98.06 | Weather Targeted | Excel | Excel |
| 20750 | Alligator Creek @ CR 107A Barbarossa Rd | 29.69 | 98.00 | Retired | Excel | – |
| 20751 | Geronimo Creek @ CR 130 Pieper Rd | 29.68 | 98.01 | Retired | Excel | – |
| 20752 | Unnamed Tributary at CR 121 Heinemeyer Rd | 29.67 | 97.96 | Retired | Excel | – |
| 20753 | Unnamed Tributary @ CR 108 Laubach Rd | 29.63 | 97.93 | Retired | Excel | – |
| 21260 | Geronimo at IH-10 | 29.59 | 97.94 | Monthly | Excel | Excel |
| 21261 | Geronimo Creek at US-90 SOLC | 29.59 | 97.93 | Monthly | Excel | Excel |
| 21262 | Spring @ Timmerman Property | 29.64 | 97.94 | Quarterly | Excel | Excel |
| GB712 | 10277-003 City of Seguin Geronimo Creek WWTF | 29.55 | 97.92 | Retired | Excel | – |
| GB713 | Water Well near Alligator Creek Headwater Springs @ Huber Road | 29.68 | 97.99 | Quarterly | Excel | Excel |
| GB714 | Water Well near Geronimo Creek @ Laubach Rd | 29.63 | 97.95 | Quarterly | Excel | Excel |
| GB715 | Water Well near Geronimo Creek @ Hollub Lane | 29.55 | 97.92 | Retired | Excel | – |
Water Quality Field & Conventional Parameters
- Field Parameters are those water quality constituents that can be obtained on-site and generally include: dissolved oxygen (DO), conductivity, pH, temperature, stream flow (not in reservoirs), and secchi disc depth (reservoirs only).
- Dissolved Oxygen indicates the amount of oxygen available in the stream to support aquatic life. DO can be reduced by the decomposition of organic matter.
- Conductivity is a measure of the water body’s ability to conduct electricity and indicates the approximate levels of dissolved salts, such as chloride, sulfate and sodium in the stream. Elevated concentrations of dissolved salts can impact the water as a drinking water source and as a suitable aquatic habitat.
- pH is a measure of the hydrogen ion concentration in an aqueous solution. It is a measure of the acidity or basic property of the water. Chemical and biological processes can be affected by the pH. pH can be influenced by dissolved constituents, such as carbon dioxide and by point and nonpoint source contributions to the stream.
- Temperature of the water affects the ability of the water to hold dissolved oxygen. It also has an impact on the biological functions of aquatic organisms.
- Stream Flow is an important parameter affecting water quality. Low flow conditions common in the warm summer months create critical conditions for aquatic organisms. Under these conditions, the stream has a lower assimilative capacity for waste inputs from point and nonpoint sources.
- Conventional Parameters are typical water quality constituents that require laboratory analysis and generally include: nutrients, chlorophyll a, total suspended solids, turbidity, hardness, chloride, and sulfate.
- Nutrients include the various forms of nitrogen and phosphorus. Elevated nutrient concentrations may result in excessive aquatic plant growth and can make a water body unfit for its intended use(s).
- Chlorophyll a is a plant pigment whose concentration is an indicator of the amount of algal biomass and growth in the water.
- Total Suspended Solids indicate the amount of particulate matter suspended in the water column.
- Turbidity is a measure of the water clarity or light transmitting properties. Increases in turbidity are caused by suspended and colloidal matter such as clay, silt, finely divided organic and inorganic matter, plankton and other microscopic organisms.
- Hardness is a composite measure of certain ions in the water, primarily calcium and magnesium. The hardness of the water is critical due to its effect on the toxicity of certain metals. Typically, higher hardness concentrations in the receiving stream can result in reduced toxicity of heavy metals.
- Chloride and Sulfate are major inorganic anions in water and wastewater. Numeric stream standards for chloride and sulfate have been set on all of the classified stream segments in the basin. Both of these inorganic constituents can impact the designated uses and can come from point and nonpoint sources, such as wastewater discharges, oil field activities, and abandoned flowing wells from groundwater with elevated concentrations of dissolved solids.
- Bacteria, specifically the E. coli bacteria, is used as an indicator of the possible presence of disease-causing organisms.
- Biological and Habitat assessment includes collection of fish community data, benthic macroinvertebrate (insects) data, and measurement of physical habitat parameters. This information is used to determine whether the stream adequately supports a diverse and desirable biological community. The physical, chemical and biological data are used together to provide an integrated assessment of aquatic life support.
- 24 Hr DO studies perform measurements of DO in frequent intervals (e.g. one hour) in a 24-hour period. The average and minimum concentrations in the 24-hour period are compared to corresponding criteria. This type of monitoring takes into account the diurnal variation of DO and avoids the bias in samples taken only at certain times of the day.
- Metals in Water, such as mercury or lead, typically exist in low concentrations, but can be toxic to aquatic life or human health when certain levels are exceeded. To obtain accurate data at low concentrations, the GBRA uses special clean methods that minimize the chance for sample contamination and provide high quality data.
- Organics and Metals in Sediment could be a source of toxicants for the overlying water, though currently there are no numeric sediment standards.